
-
 Analytical & Elemental Instruments
-
Biotechnology Lab Items
-
Cardboard and Box Factory Lab Equipment Solution
-
Cleanroom Solution
-
Consumables & Accessories
-
Dosing Pump for Chemicals
-
Electrochemistry & Titration
-
ETP -Effluent Treatment Plant
-
Feed Quality Laboratory
-
Food & Kitchen Lab Items
-
Hygiene Testing Equipment
-
Lab Furniture




The Invisible World in Your Vial: Understanding Liquid-Borne Particles and Mastering LBPC Measurement
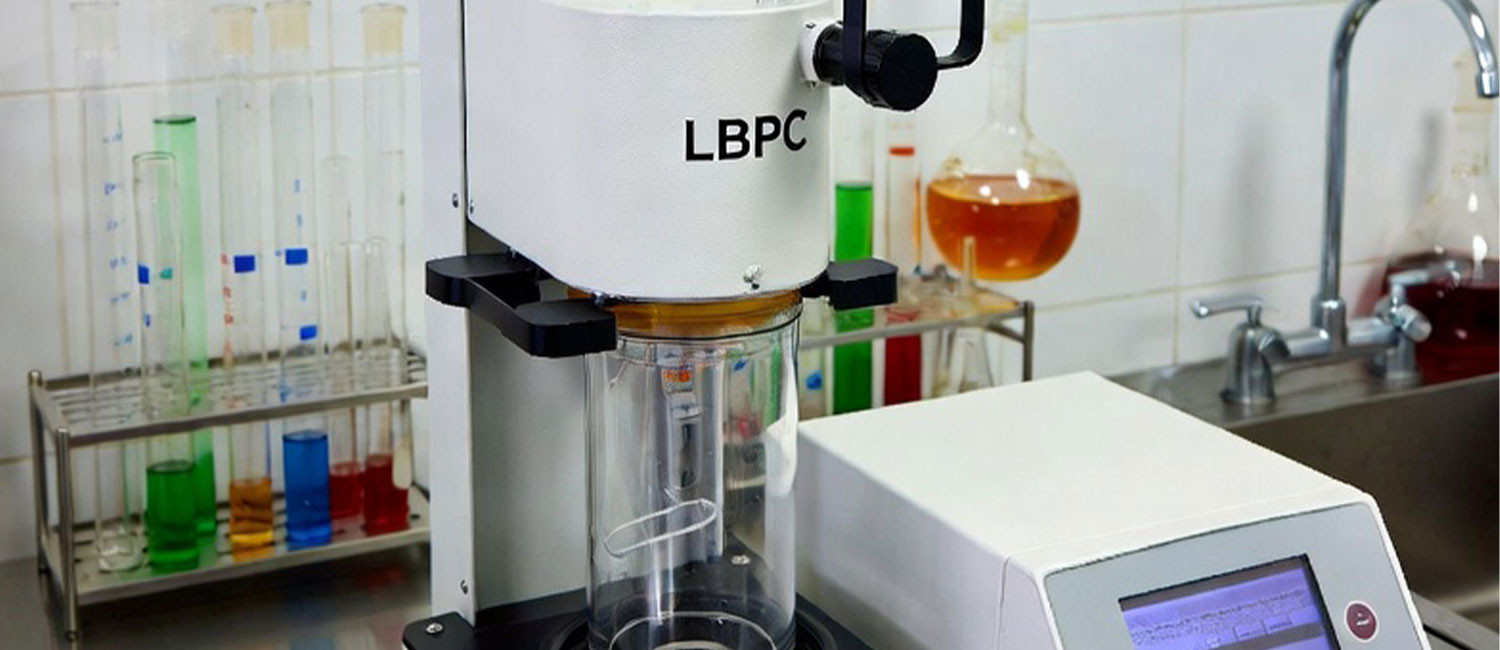
As microbiology lab professionals, we often look at a vial of Water for Injection (WFI) or a liquid pharmaceutical product and see… clarity. But as we know, "clear" to the naked eye doesn't mean "clean" to the sensor.
Liquid-borne
particles—tiny solids or liquids suspended in a medium—are a critical quality
attribute. Whether it’s ensuring patient safety in injectables or maintaining
environmental standards, understanding these particles is half the battle. The
other half? Accurately measuring them.
In
this post, we’ll dive into the behavior of these particles, why your LBPC
readings might fluctuate, and how to stay within the "Gold Standard"
of tolerance limits.
Part
1: What Are We Actually Counting?
When
your Light Obscuration Particle Counter triggers a count, what is it seeing?
It’s usually one of four things:
1.
Inorganic Particles: The
"hardware" debris. This includes rust, glass flakes, sand, or mineral
precipitates. These usually come from environmental contamination, equipment
wear, or chemical reactions.
2.
Organic Particles: The
"biological" debris. This is our wheelhouse—bacteria, fungi, and
fibers from clothing or paper. It also includes synthetic polymers and organic
detritus.
3.
Emulsions: Fine dispersions of
immiscible liquids, like oil droplets in water.
4. Bubbles: The
"Imposters." Gas bubbles are the arch-nemesis of accurate particle
counting. To a laser sensor, a micro-bubble looks exactly like a particle,
often leading to false high readings.
Part
2: The Physics of the Vial (Particle Behavior)
Why
does a sample passed now look different from the same sample passed ten minutes
later? It comes down to fluid dynamics and particle physics.
·
The Gravity Factor: Density
rules all. Heavier inorganic particles (metal, sand) want to settle. If your
stirring is too slow, they sink; too fast, and you create bubbles.
· The
"Floaters": Organic fibers and less dense particles may remain suspended or
float to the top.
· Surface
Charge: Particles aren't neutral. They carry charges that can cause them
to repel (staying separate) or attract (agglomerating/flocculating). A cluster
of small particles might suddenly be read as one giant particle.
·
Brownian Motion: For the
tiniest nanoparticles, gravity is irrelevant. They bounce around due to
collisions with liquid molecules, staying suspended indefinitely.
Part
3: The Reality of Data Variation
A
common question in the lab is: "I tested this sample twice. Why aren't
the numbers identical?"
The
short answer: Particle counting is statistical, not absolute.
Even
with a perfectly calibrated instrument, you will never get 100%
identical readings on repeated runs. Here is why:
1. Poisson Distribution (The "Scoop of Sand" Effect)
Imagine
scooping sand from a bucket. One scoop has 102 grains; the next has 98. Particles
are rarely distributed perfectly evenly in a liquid. Your instrument analyzes a
specific volume (e.g., 5mL). The number of particles in that 5mL
"scoop" naturally fluctuates around the true average.
2. The Instrument Factors
·
Flow Rate: The high-pressure pumps
in LBPC systems have a volume tolerance of ±5%. If the pump pulls 4.9mL
one time and 5.1mL the next, the count will vary proportionally.
·
Electronic Noise:
Interference from nearby mobile phones or motors can introduce
"noise" into the sensitive laser detection circuitry.
3. The Sample Factors
·
Micro-bubbles: If a
bubble detaches from the wall of the beaker during Run 2 but not Run 1, your
data will spike.
·
Settling: If a sample isn't stirred
effectively, the first test (drawing from the top) might have fewer particles
than the final test (drawing from the bottom).
Part
4: How Much Variation is Too Much? (Tolerance Limits)
Since
variation is inevitable, how do we know if a test passed? We rely on a
hierarchy of limits, often defined by Pharmacopoeia standards (like USP
<788>).
The "Hard" Limits (Instrument Health)
These
are checked during Performance Qualification (PQ) or Calibration. If the
machine fails these, stop working.
·
Volume Accuracy: Must be
within ±5%.
· Count
Accuracy: When testing a standard (e.g., 10µm beads), the result must be
within ±10% of the certified value.
·
Precision (Repeatability): The
Relative Standard Deviation (RSD) between runs must be ≤ 2%. This proves
the instrument is consistent.
The "Soft" Limits (Routine Testing)
Because
of the Poisson distribution mentioned above, we don't trust a single run. The
standard protocol for routine testing usually follows the "Test 6,
Discard 1, Average 5" rule.
·
Discard the 1st: This
clears the line and removes "startup" variation.
· Average
the next 5: This smooths out the statistical noise.
·
The Tolerance: You
compare this final average against the pass/fail limit of the product
(e.g., "Not more than 6000 particles ≥10µm").
Part
5: The LBPC Checklist for Lab Personnel
To
ensure your variation is statistical (natural) and not procedural (error), keep
this checklist in mind for every test:
1.
Ban the Bubbles: Degas
your samples! Let them stand or use a vacuum. Bubbles are the #1 cause of
"unstable readings" and false failures.
2.
The Goldilocks Stirring: Adjust
the magnetic stirrer. Too slow = settling particles. Too fast = vortex and
bubbles. Aim for a moderate, consistent speed.
3.
Needle Position: Place
the sampling needle approximately 1cm from the bottom. Too low sucks up
sediment; too high risks sucking air.
4.
Electromagnetic Hygiene: Keep
mobile phones away from the instrument. RF signals can mess with the laser
sensor’s voltage.
5. Clean Up: Always
run a "Rinse" cycle with purified water between different sample
types, and "Drain" if finishing for the day. Mold growing in a damp
tube is a microbiologist's nightmare—and a particle counter's enemy.
Happy Counting!
Understanding the behavior of liquids and the limits of our
instruments turns data into actionable quality assurance.
Recent Posts

How Viscosity, Rheometer & Texture Analyzer Shape Product Quality in R&D Laboratories?

How Laboratory Heating & Cooling Equipment Improves Accuracy and Efficiency in Testing?

The Role of Laboratory Safety & Environmental Monitoring in Risk Prevention

Health and Hygiene Ware Material Testing: Ensuring Quality, Safety, and Compliance
Advancements in Sample Preparation Equipment for R&D and Quality Control

Essential Biotechnology Lab Items and Their Applications in Modern Research



Understanding ETP – Effluent Treatment Plant and Its Importance in Industry
Optimum Solution– Laboratory & Analytical Instruments Supplier in Bangladesh
Optimum Solution is a leading supplier of laboratory equipment, analytical instruments, and process control solutions in Bangladesh. Since our inception, we have built a strong presence in the industry, serving research labs, universities, pharmaceutical companies, and quality control laboratories nationwide. Through continuous dedication to improving our products and services, Optimum Solution has earned the trust and loyalty of our valued clients.


