
-
 Analytical & Elemental Instruments
-
Biotechnology Lab Items
-
Cardboard and Box Factory Lab Equipment Solution
-
Cleanroom Solution
-
Consumables & Accessories
-
Dosing Pump for Chemicals
-
Electrochemistry & Titration
-
ETP -Effluent Treatment Plant
-
Feed Quality Laboratory
-
Food & Kitchen Lab Items
-
Hygiene Testing Equipment
-
Lab Furniture




How Viscosity, Rheometer & Texture Analyzer Shape Product Quality in R&D Laboratories?

In R&D laboratories, small changes in flow can affect how a product mixes, pours, spreads, or pumps. That is why viscosity measurements matter so much for product quality. They help you understand fluid flow before problems show up in production or customer use. When you add tools like a rheometer and a texture analyzer, you get a fuller picture of how materials behave. This makes it easier to build products that feel right, perform well, and stay consistent from batch to batch.
Key Highlights
Viscosity measurements show how easily materials move, from low viscosity liquids like water to high viscosity products like peanut butter.
A rheometer helps R&D teams study how shear rate and shear stress change flow behavior.
A texture analyzer checks firmness, spreadability, and other material property details that shape user experience.
Together, these tools support quality control across labs and production.
Better testing helps you improve pouring, pumping, mixing, and consistency.
Clear data leads to stronger product quality decisions.
Understanding Viscosity in Product Development
Viscosity is a measure of a fluid and its resistance to movement. In simple terms, it tells you how thick or thin a material feels when it flows. This comes from internal friction, or the force that resists layers of fluid sliding past each other.
For product teams, viscosity helps explain why different materials behave in different ways. The main types of viscosity include dynamic viscosity and kinematic viscosity. Knowing both can help you compare liquids more clearly and choose the right process, test method, or application.
What Is Viscosity? Simple Explanation for R&D
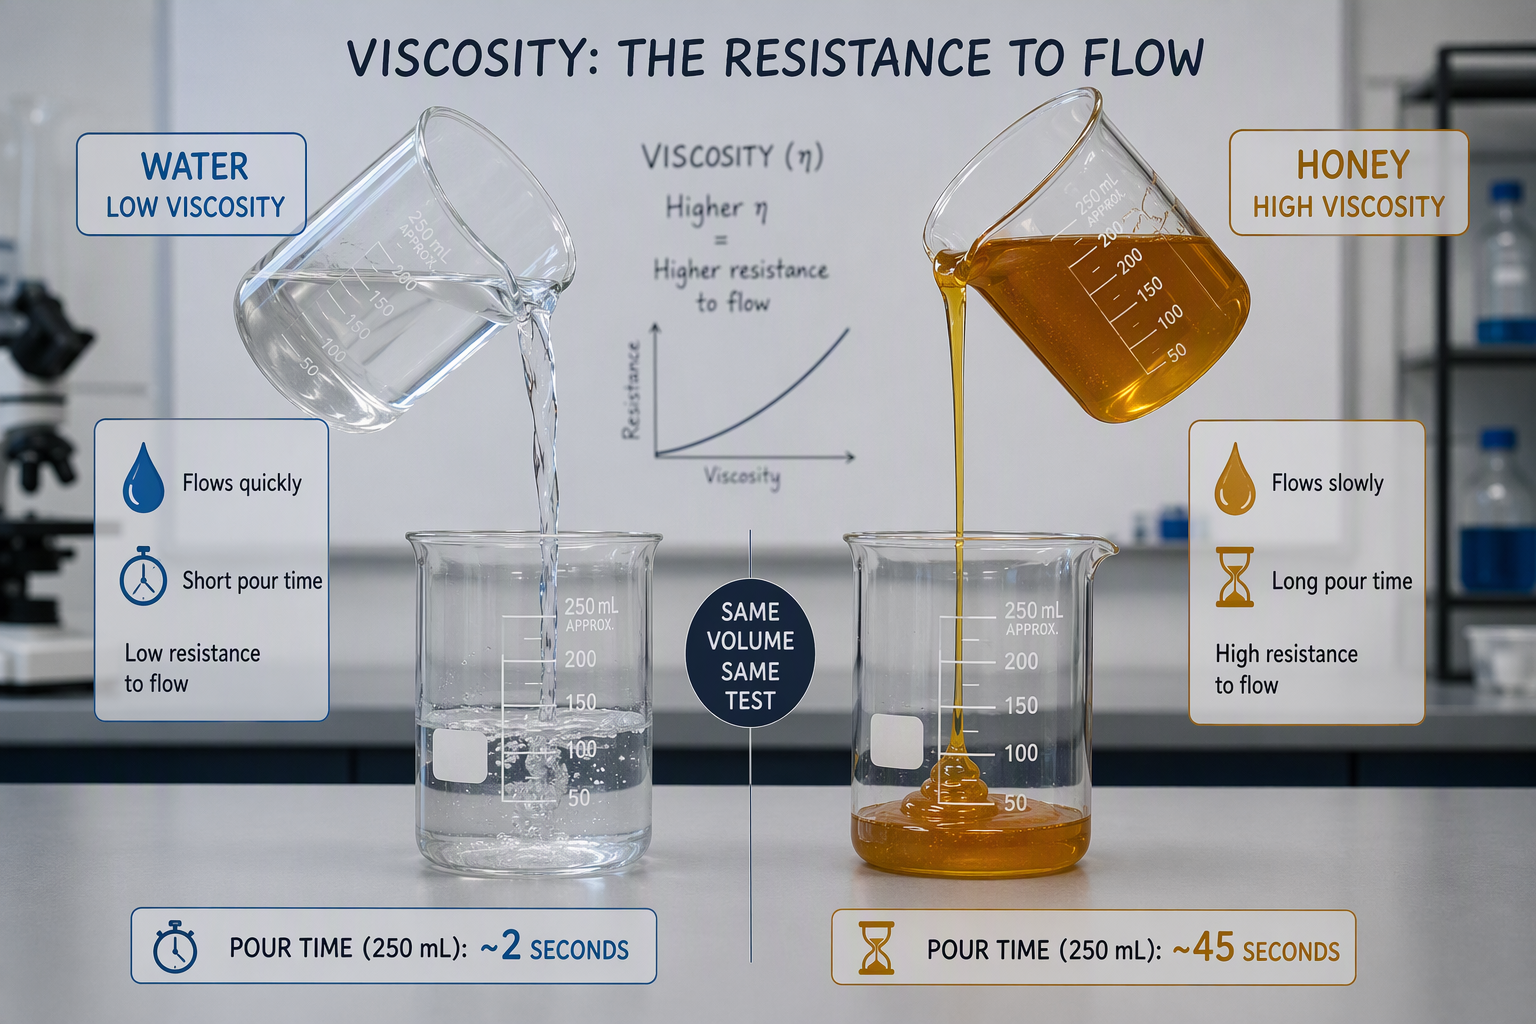
Viscosity is the measure of a fluid’s resistance to flow. If you want a simple explanation, think about how easily a liquid pours. Water moves fast because it has low viscosity. Honey moves slowly because it has high viscosity. That basic understanding is often enough to explain what you see in a lab or on a production line.
At a molecular level, viscosity comes from internal resistance within the liquid. It reflects how hard it is for layers to move past each other under an external force. This is why people often describe it as a kind of internal friction.
In testing, you will often hear about dynamic viscosity and kinematic viscosity. Dynamic viscosity focuses on the forces involved in movement. Kinematic viscosity depends on the density of the liquid as well. Both help R&D teams compare materials with more precision.
How Viscosity Influences Fluid Flow and Material Behavior
When viscosity rises, fluid flow slows down. When viscosity drops, the material moves more easily. This is why the viscosity of water is often used as a simple reference point. Water pours quickly, while syrup, dish soap, or honey resist movement and take more time to spread or drain.
The reason is internal friction. As layers of fluid move, they resist sliding past one another. That resistance can change how a product fills molds, passes through pipes, or releases from a bottle. In some products, the effect becomes even clearer as shear rate changes during stirring, pumping, or mixing.
Good viscosity data helps you predict these changes before they become defects. You can see whether a material will de-air easily, trap bubbles, or need extra process steps. That makes flow behavior easier to manage during development.
Real-world Examples of High and Low Viscosity Materials
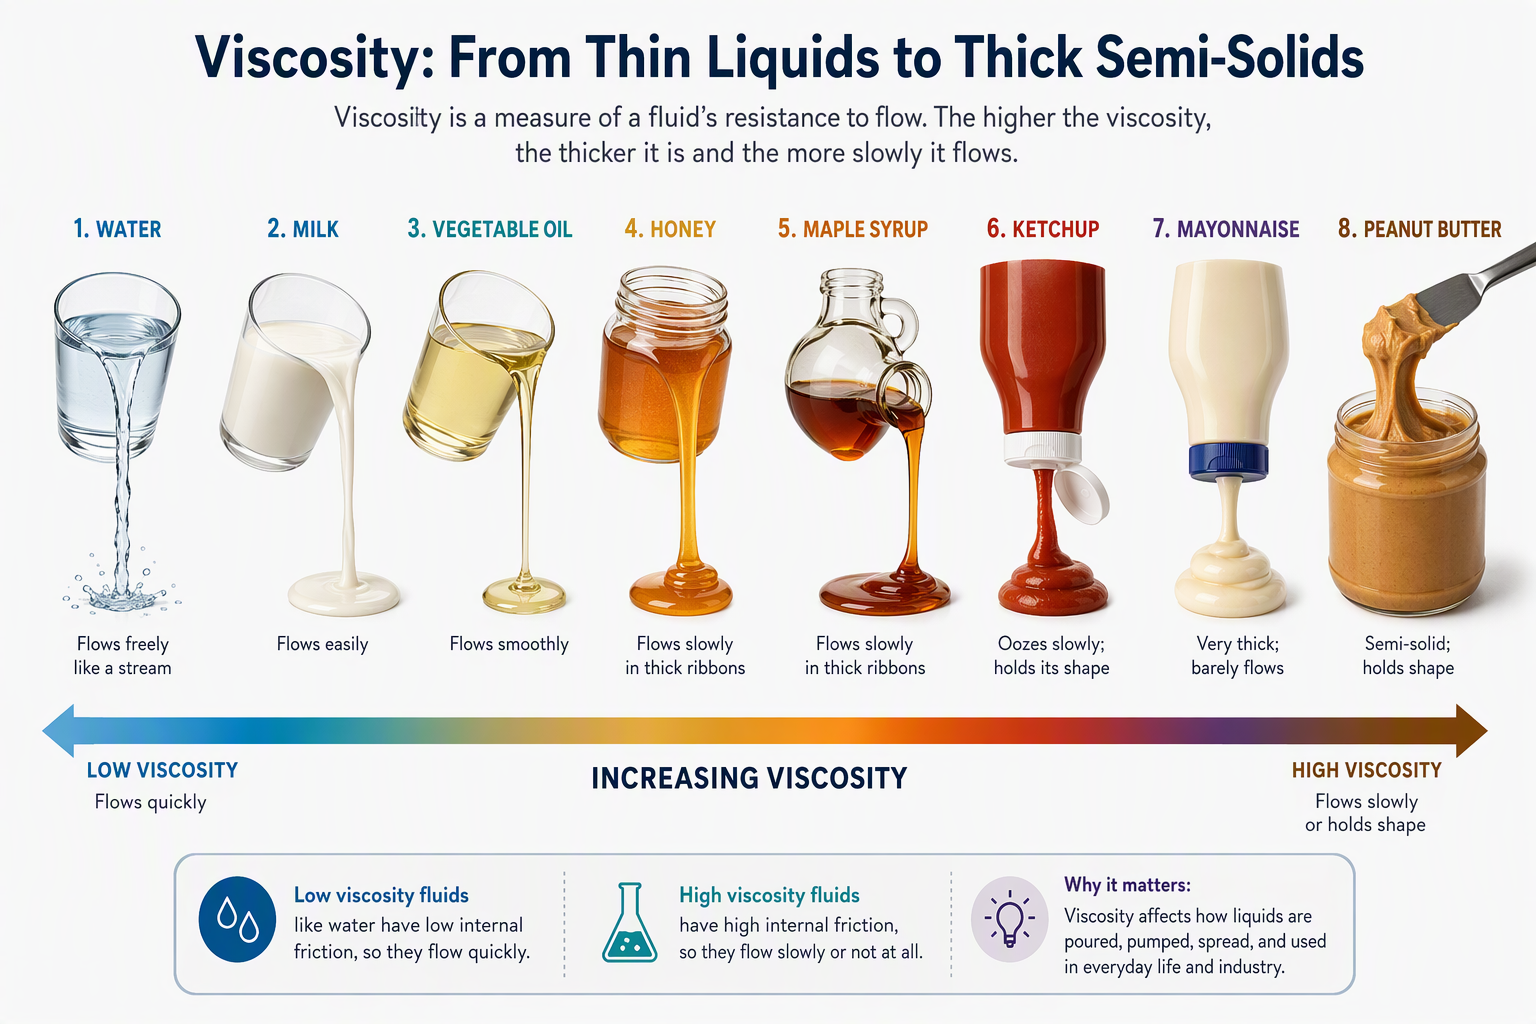
You see viscosity every day, not just in labs. Some common liquids move fast and feel thin, while others hold their shape and barely pour. These differences are easy to notice, which makes them useful for explaining viscosity measurements to nontechnical teams.
Here are familiar examples across the scale:
Water is a low viscosity liquid at about 1 centipoise.
Milk and light cream are also low viscosity to moderate flow materials.
Vegetable oil, maple syrup, and dish soap sit in a more medium range.
Honey and melted chocolate are high viscosity examples.
Peanut butter is an extreme high viscosity material and may not pour at all.
These examples matter because they connect lab numbers with real handling behavior. If your sample flows like water, you plan for easy movement. If it behaves more like peanut butter, you may need different tools, more force, or extra care during processing.
The Importance of Viscosity in Different Industries
Many industries rely on viscosity measurements because flow affects both processing and final use. If a material is too thin, it may run, leak, or fail to coat properly. If it is too thick, it may not pump, pour, or mix as needed. That makes viscosity a practical quality control tool.
In manufacturing, chemical engineers use viscosity data to help with equipment choice, energy use, and line design. Pump performance can change a lot across low, medium, high, and very high viscosity materials. Choosing the wrong setup can reduce efficiency or even cause failure.
This matters in areas such as food, chemicals, and the automotive industry, where products must move reliably through systems. By measuring viscosity early, you reduce surprises and improve repeatability. The next step is understanding what causes those values to shift.
Key Factors Affecting Viscosity Measurements
A fluid’s viscosity is not always a fixed number. Viscosity measurements can change when the material, the test conditions, or the environment changes. That is why one sample may behave differently from another, even when they look similar at first.
In R&D work, you need to watch the variables that affect dynamic viscosity and absolute viscosity. Temperature is a major factor, but concentration, shear, composition, particle shape, and surroundings also matter. Looking at these factors helps you interpret results with more confidence.
Temperature Effects on Liquid and Solid Materials
Temperature has a direct effect on viscosity. For most liquids, warmer conditions lower viscosity and cooler conditions raise it. That means the same sample can pour easily one day and feel much thicker the next if the room is colder.
This is why close temperature control of the fluid matters during testing. Many material specifications are reported at a set condition, such as 73°F or 23°C. If your lab or shop is colder than that, your sample will likely show higher resistance to flow than the listed value.
These viscosity changes affect handling, mixing, and air release. Heating can reduce resistance and make pumping easier. It can also help room-temperature solids such as chocolate, wax, or asphalt move through equipment. For dependable comparisons, you need consistent test temperature every time.
Concentration, Shear Rate, and Chemical Composition
Not all fluids respond the same way during motion. Some keep a steady flow pattern, while others thin out when shaken, stirred, or pumped. That means shear rate can change the apparent behavior of the same sample during use.
Chemical composition also matters because it shapes how strongly the material resists movement. Since viscosity is a measure of a fluid, even small changes in formulation can shift performance. In some calculations, teams also compare the ratio of dynamic viscosity to other material values to better understand test results.
Key influences include:
Higher concentration can make a fluid thicker and harder to move.
A changing shear rate can lower viscosity in shear-sensitive materials like ketchup.
Chemical composition can alter flow, pumping behavior, and sample consistency.
Together, these factors explain why lab results must match the real process conditions as closely as possible.
The Role of Particle Size and Shape
Particle size can change how a material moves, especially when the fluid contains suspended solids or thick components. Larger or more irregular particles can make movement harder because they create more resistance inside the mixture.
Shape matters too. Sharp, uneven, or bulky particles can increase internal friction as the material flows around them. That added resistance can raise the apparent thickness of the sample and shift how it behaves during mixing, filling, or pumping.
For R&D laboratories, this means viscosity measurements should not be viewed in isolation. A sample with different particle size distribution may show a different relative viscosity, even if other conditions appear similar. Watching particle characteristics helps you explain unexpected results and choose more reliable processing methods.
Environmental Impacts on Viscosity
The environment around your sample can influence what you measure. Room conditions, storage conditions, and test setup all play a part in how a fluid responds. Even before a spindle turns or a cup drains, the sample may already be changing.
Environmental impacts become important when materials are sensitive to temperature shifts or handling differences. A colder area can increase thickness, while warmer conditions can reduce it. In practical testing, related properties such as surface tension may also affect how a sample spreads, pours, or forms a clean flow path.
For some materials, these surrounding conditions can influence bulk viscosities and how repeatable your results are. That is why labs work to keep methods stable and samples prepared in the same way each time. Consistency in the environment supports consistency in the data.
Introduction to Rheometers in R&D Laboratories
A rheometer is an advanced tool used to study how materials flow under force. While basic viscosity measurements tell you how thick a sample seems, a rheometer gives deeper insight into behavior during mixing, pumping, or stirring. It is especially useful when flow changes with use.
In R&D laboratories, this makes the rheometer valuable for quality control and development work. It goes beyond a simple measure of a fluid and helps you see how shear affects performance. That extra detail supports better decisions about formulations and process settings.
What Is a Rheometer? Core Principles
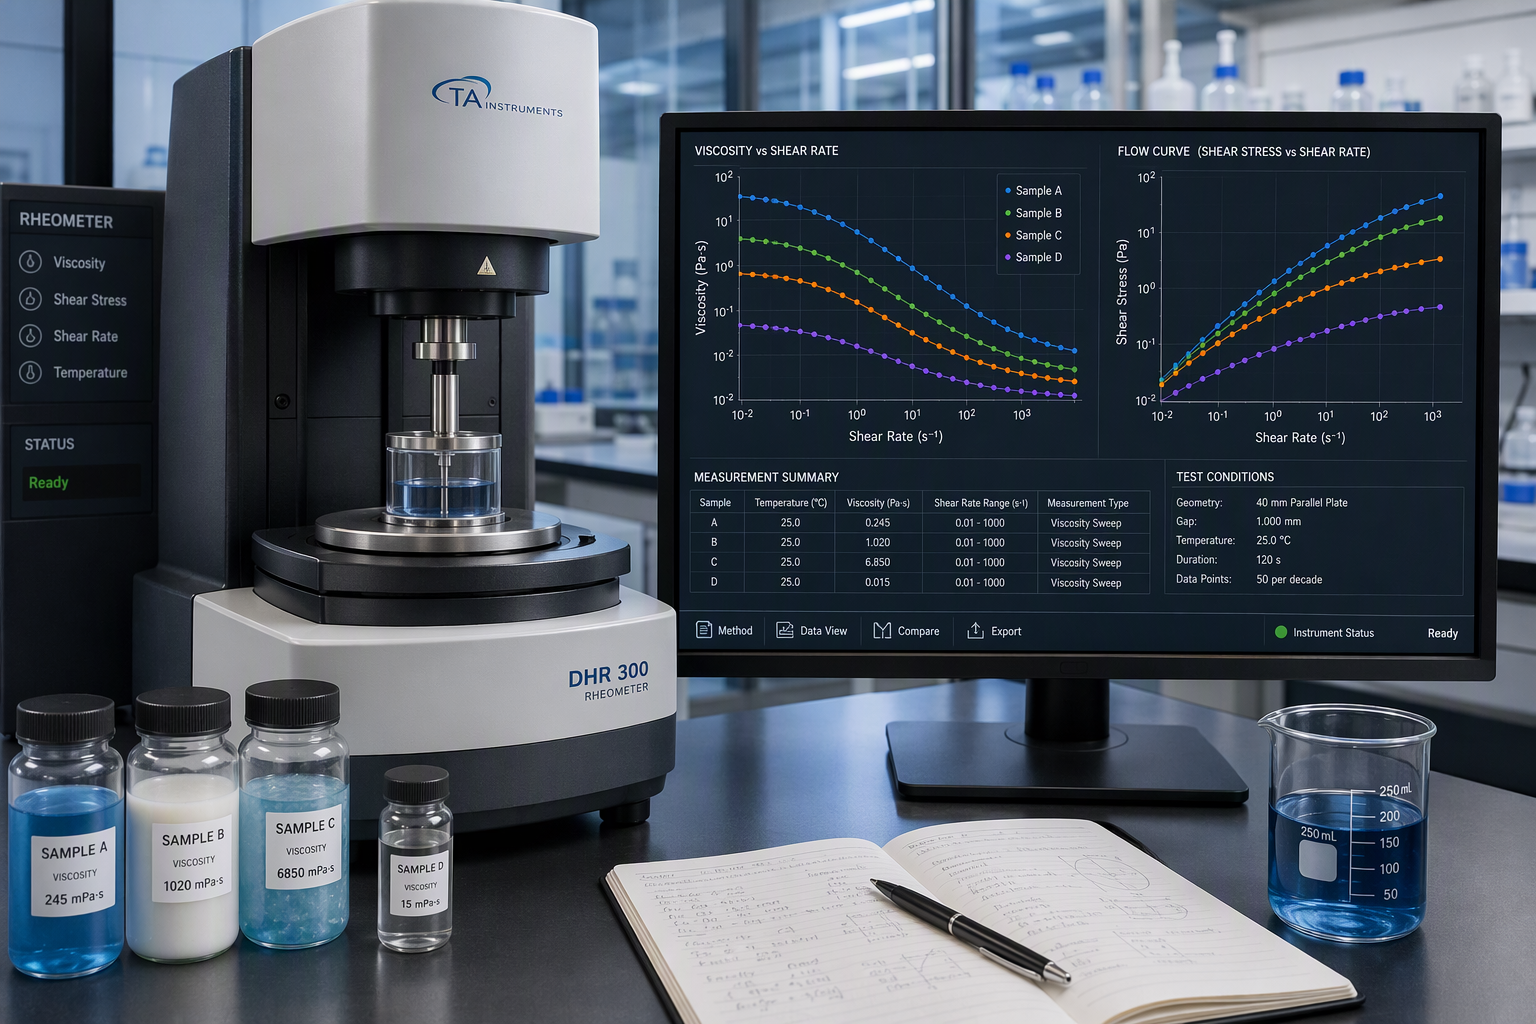
A rheometer is an instrument that studies how a material responds when force is applied. In simple terms, it measures how a sample flows or deforms under controlled conditions. This makes it more informative than a simple pass-or-fail viscosity check.
Its core job is to connect shear stress and shear rate. Shear stress is the force applied to move the material. Shear rate describes how quickly the layers move relative to each other. By controlling both, the rheometer shows whether a sample behaves steadily or changes under motion.
That matters because viscosity is not always just one number. A rheometer helps you build a fuller measure of a fluid in real working conditions. If a product is stirred, pumped, or squeezed during use, rheometer testing can reveal behavior that simpler tools may miss.
Types of Rheometers and Their Applications
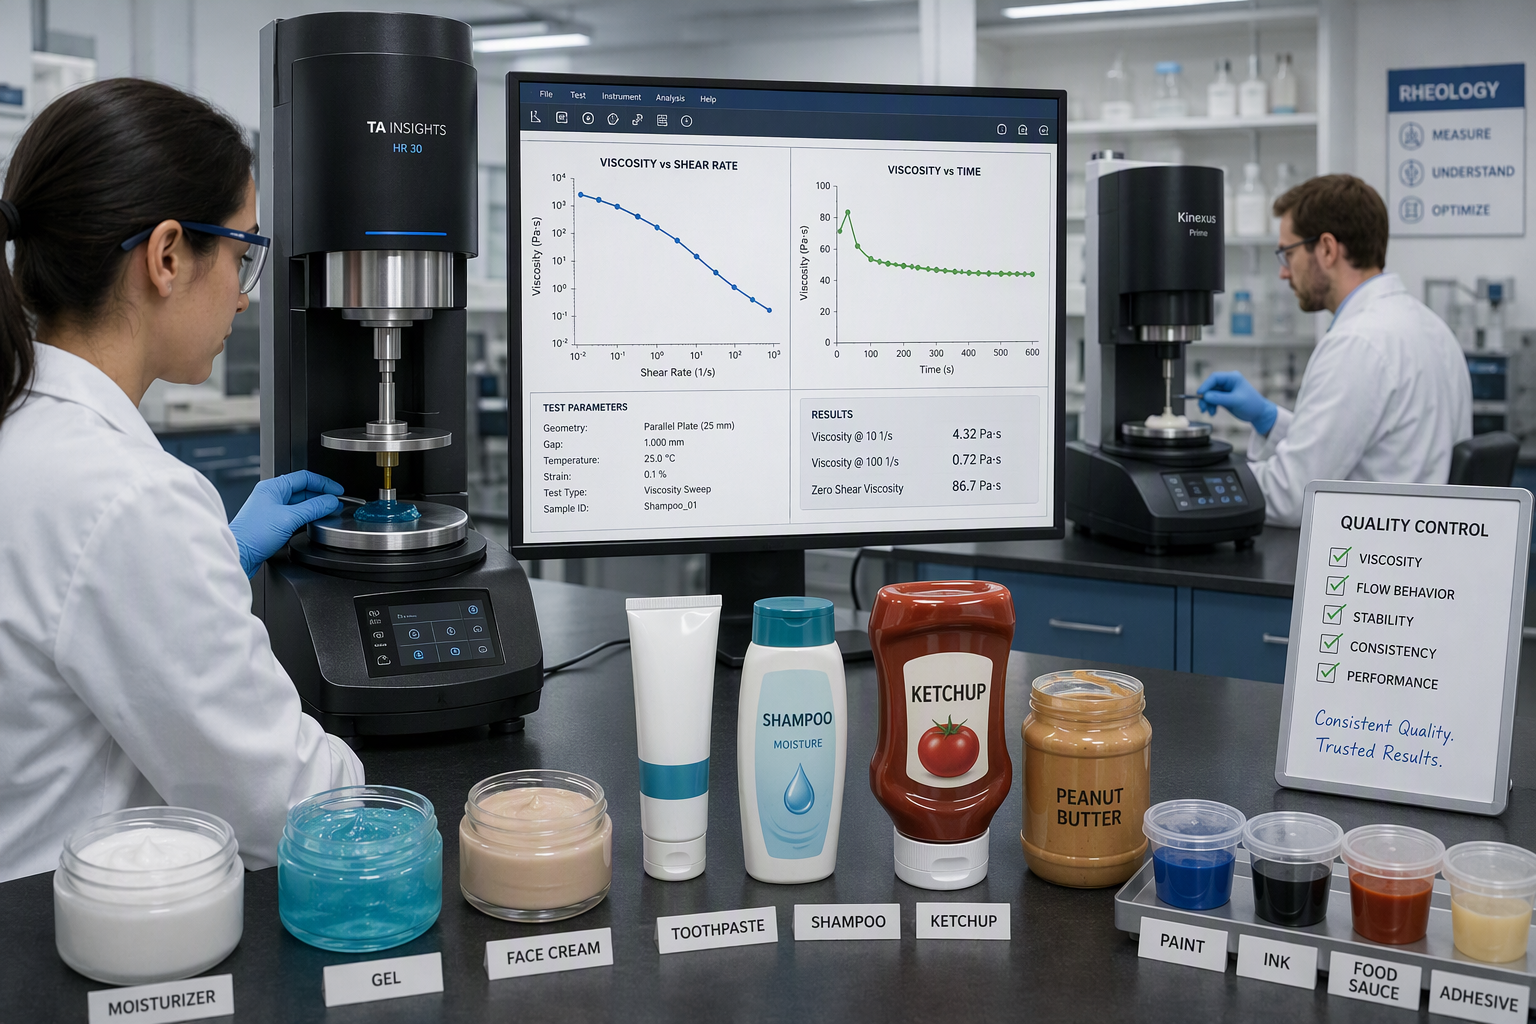
A rheometer belongs to the wider group of tools used for flow testing, but it offers more detail than many basic instruments. Compared with other types of viscometers, it is especially useful when you need to understand changing flow behavior instead of just a single result.
In practical lab work, different designs can use rotating parts such as cups, rods, cones, or plates to apply force and record response. This helps teams study absolute viscosity and observe how a sample reacts under different testing conditions.
Common applications include:
Checking shear-sensitive products that change during mixing or pumping
Studying very thick samples where simple flow tests are limited
Comparing material response across different force levels
Supporting development when one fixed viscosity value is not enough
For complex products, a rheometer often becomes the preferred instrument.
How Rheometers Help Analyze Material Properties
A rheometer helps you study more than thickness alone. It reveals how a sample responds when force, motion, or processing conditions change. That makes it useful for understanding each material property that influences handling and end use.
From a fluid mechanics point of view, this is important because many products are moved through pipes, pumps, fittings, and mixers before they ever reach a customer. The instrument can show whether the material stays stable or becomes easier to move under stress. That directly answers how viscosity affects fluid flow in real systems.
For R&D teams, better viscosity measurements mean fewer surprises later. A rheometer can identify behavior that explains air trapping, poor dispensing, or unstable process performance. Those insights help improve formulations before scale-up or quality issues appear.
Why Rheometer Data Matters for Product Quality
Rheometer results matter because product quality depends on how materials behave in use, not just how they look in a container. A syrup that pours too slowly or an oil that becomes too thin under motion can create a poor experience, even if the formula seems correct on paper.
That is where viscosity data becomes useful. It helps you connect lab behavior to everyday performance. If the material changes a lot during stirring, squeezing, or pumping, a simple number may not tell the whole story. The rheometer fills that gap.
For quality control, accurate measurements support better decisions about acceptance limits, formulation changes, and processing conditions. You can compare batches with more confidence and spot issues before they reach production. That same practical thinking also applies to texture testing.
Exploring Texture Analyzers in Product Testing
A texture analyzer measures how a product responds to pressing, pulling, or other controlled movement. While it is not the main tool for viscosity scales, it helps you evaluate related material property traits such as firmness, spreadability, or resistance to deformation. These qualities matter in real product use.
In R&D laboratories, a texture analyzer adds another layer to quality control. It helps you understand what a user may feel when handling the product. Combined with flow data, it gives a more complete picture of performance.
Understanding Texture Analysis and Its Relevance
Texture analysis looks at how a sample responds when it is compressed, stretched, or otherwise challenged in a controlled test. A texture analyzer records that response and turns feel-based impressions into measurable data. This helps R&D teams move beyond guesswork.
Its relevance becomes clear when product success depends on touch and handling. A thick spread, a soft gel, or a firm paste may all require a certain response to pressure. Those reactions are part of the material property profile and can shape consumer satisfaction.
Because these tests involve controlled relative motion between the probe and the sample, they can highlight differences that users will notice. When paired with flow testing, texture analysis can support stronger predictions about how acceptable or pleasing a product may feel in everyday use.
Methods Used in Texture Analyzer Instruments
A texture analyzer uses controlled mechanical actions to test how a sample responds. It does not replace viscosity tools, but it complements them by measuring firmness, resistance, or spread under force. This helps when flow alone does not explain product handling.
Since products can show different types of viscosity and different touch responses, texture methods are often chosen to match the likely use of the sample. Best practices include keeping sample preparation and test conditions as consistent as possible so results are meaningful.
Typical texture analyzer approaches include:
Compression-style testing to assess firmness or softness
Penetration-style testing to study resistance under a probe
Spread or deformation testing to compare handling behavior
If you need to measure the viscosity of a liquid directly, a viscometer or rheometer is still the better choice. Texture testing adds supporting insight.
Interpreting Texture Analysis Results for R&D
Reading texture analyzer results starts with one question: what should the product feel like in use? A number alone is not enough. You need to connect the result to the target experience, whether that means easy spreading, strong body, or a smooth press response.
This is where texture data works well with viscosity measurements. One tool may show how a sample flows, while the other shows how it resists force. Together, they describe the material property profile more fully than either method alone.
For R&D teams, that combined view can support better predictions about consumer satisfaction. If a sample pours correctly but feels too firm, or feels pleasant but flows poorly, you can adjust the formula earlier. Better interpretation leads to better choices before launch.
Comparing Texture Analyzer vs. Rheometer Data
A texture analyzer and a rheometer both help you understand product behavior, but they answer different questions. A rheometer focuses on flow under applied force. A texture analyzer focuses on physical response such as firmness or deformation during contact.
If you are asking about the difference between a viscosity test and a rheology test, the main point is depth. Basic viscosity measurements often give one flow value. Rheology testing studies how flow changes with stress or motion. Texture data then adds another practical layer tied to feel and handling.
Tool | Main focus | What it helps you understand |
|---|---|---|
Rheometer | Flow under shear stress and shear rate | Changes in viscosity, movement in processing, rheology behavior |
Texture analyzer | Force, firmness, deformation | Handling feel, spreadability, resistance, touch response |
Basic viscosity test | Single flow value | How thick or thin a sample seems under set conditions |
Used together, these tools create a stronger testing strategy.
Measuring Viscosity: Tools and Techniques
You can measure the viscosity of a liquid in several ways, depending on the sample and the level of detail you need. Some methods are simple and low cost, while others are more advanced and better suited for controlled lab work. The right instrument depends on the product.
Common options include several types of viscometers, along with capillary tubes, falling ball methods, and rotational systems. The compiled information also notes that tools vary widely in price and measurement range. Each approach supports viscosity measurements in a different way.
Rotational Viscometers and Their Benefits
Among the common types of viscometers, rotational viscometers are widely used for lab testing. They work by rotating a spindle, cup, rod, cone, or plate in the sample and measuring the resistance created during movement. That makes them useful for more detailed flow work.
One big benefit is that rotational viscometers support viscosity measurements across a broad range, including very thick materials. For high viscosity products, this method is often the best option because simple pour tests or drainage methods may not work well.
Another advantage is that they can show how shear affects the liquid. This is helpful when a product changes during stirring or pumping. If you want to measure the viscosity of a liquid under more realistic process conditions, rotational systems give you much more insight than a rough estimate alone.
Capillary and Falling Ball Methods
Capillary methods use capillary tubes to measure how long it takes a set fluid sample to move through a controlled path. In lab settings, this often means a U-shaped glass tube with bulbs. The measured time helps estimate how easily the sample flows.
The falling ball approach works differently. A weighted ball or piston moves through the liquid, and the test records how long that descent takes. In both methods, time is the key value. The slower the movement, the higher the resistance to flow.
These approaches are useful for viscosity measurements when the sample fits the method well. Capillary systems are popular for smaller lab samples, while falling ball testing follows a simple physical idea many people can understand quickly. One limitation noted in the compiled information is that falling ball methods cannot be used on opaque liquids.
Common Units and Scales for Reporting Viscosity
Viscosity is usually reported with standard units so teams can compare materials clearly. If you have ever wondered how viscosity is represented on a scale, the most common answer is through centipoise for dynamic results and centistokes for kinematic results. Water at 20°C is the usual reference point.
Dynamic values relate to force and are often linked with absolute viscosity. Kinematic values also account for density. In simple terms, one tells you about resistance under motion, while the other reflects flow with density included. In more technical descriptions, force may be considered across a unit area.
Useful reporting points include:
Centipoise, or cP, is the common unit for dynamic viscosity.
Centistokes, or cSt, is the common unit for kinematic viscosity.
A simple conversion uses specific gravity to move between cP and cSt.
Good viscosity data is easier to use when units are always reported clearly.
Best Practices for Accurate Viscosity Measurement
Accurate measurements depend on consistency. If you want reliable viscosity measurements, you need to control the method, the sample condition, and the testing environment. Without that, two results from the same material may not match well enough to guide decisions.
Good best practices start with temperature control, because even small shifts can change flow behavior. You also need the right instrument for the material range. Low viscosity liquids may work with simpler methods, while thick or shear-sensitive products often need rotational tools or a rheometer.
Sample preparation matters too. Use the same handling steps, the same test timing, and the same setup whenever possible. If air bubbles, temperature drift, or mismatched tools are allowed into the process, your data becomes harder to trust. Better habits lead to better comparisons and stronger lab conclusions.
Impact of Viscosity, Rheometer & Texture Analyzer on Product Quality
Product quality depends on more than appearance. A material must also move, spread, pump, or feel the right way during real use. That is why viscosity measurements are important for understanding different materials. They reveal behavior that affects processing and customer experience.
A rheometer adds detail about flow under force, and a texture analyzer adds insight into feel and resistance. Together, these tools give R&D teams a practical way to connect lab results with product quality, consistency, and performance across industries.
Applications in Food and Beverage Product Innovation
In the food industry, viscosity connects directly to what people notice first. Oils, syrups, sauces, and spreads all create expectations based on how they pour or hold shape. If the flow feels wrong, the product can seem low quality even before taste is considered.
That is why viscosity measurements support product innovation. A low viscosity liquid may pour cleanly and quickly, while a high viscosity product may need a spoon, a squeeze, or a stronger pump. Everyday examples such as vegetable oil, maple syrup, honey, and peanut butter make this easy to understand.
For R&D teams, the goal is not simply thinner or thicker. It is matching the target use. The right viscosity helps with filling, processing, and consumer handling. Better flow decisions can improve both factory performance and the experience at the table.
Ensuring Consistency in Pharmaceuticals and Cosmetics
Consistency matters in products where handling and repeatability shape trust. In the pharmaceutical industry and in cosmetics, a product that feels or flows differently from batch to batch can create immediate concern. Viscosity gives teams a measurable way to monitor that risk.
Viscosity measurements help quality control teams compare production lots and catch changes early. If a formulation becomes too thick, it may be harder to dispense or spread. If it becomes too thin, it may not perform as intended in packaging or application.
This is why viscosity is important for understanding different materials. Two products can look similar, yet behave very differently when squeezed, pumped, or applied. Tracking flow properties helps labs keep performance aligned with product expectations and manufacturing needs.
Enhancing Industrial and Chemical Product Performance
Industrial products often move through pumps, pipes, valves, and fittings before they ever reach final use. In these systems, viscosity affects how fluids flow by changing resistance during transfer. A thin liquid moves easily, while a thick one can slow production and raise mechanical demands.
This is where viscosity measurements help chemical engineers make practical choices. They use flow data to support pump selection, system sizing, and energy planning. The compiled information makes clear that pumps built for water and other thin liquids may perform poorly or fail with viscous materials.
For industrial products, better flow understanding means better performance. It can reduce frictional losses, improve transfer, and help determine whether heating is needed to lower resistance. In short, measuring flow behavior helps keep systems efficient and materials manageable.
Case Study: Success Stories from R&D Laboratories
A useful case study in R&D starts with a common problem: a product behaves well in small trials but fails during scale-up. Often, the missing piece is not chemistry alone. It is incomplete understanding of flow, handling, or feel under real process conditions.
In a stronger development approach, labs use viscosity measurements first to define whether the sample behaves like water, syrup, honey, or something closer to peanut butter. A rheometer then shows whether stirring or pumping changes the response. A texture analyzer adds insight into firmness or spread behavior during use.
That combination can turn trial-and-error into a more controlled path. Instead of reacting to defects late, teams identify risks earlier and adjust with more confidence. The result is a practical success story: fewer surprises, better consistency, and clearer decisions from lab to production.
Conclusion
In summary, understanding the roles of viscosity, rheometers, and texture analyzers is crucial for enhancing product quality in R&D laboratories. By accurately measuring these properties, businesses can ensure their products meet industry standards and consumer expectations. Whether in food and beverage innovation or pharmaceuticals, the insights gained from these tools help streamline formulations, improve consistency, and ultimately lead to greater customer satisfaction. As you navigate your product development journey, keep these instruments at the forefront of your strategy. If you're ready to elevate your R&D processes, consider reaching out for a free consultation to explore how these technologies can benefit your projects.
Frequently Asked Questions
How do viscosity and texture measurements impact daily product choices?
Viscosity measurements and texture analyzer results shape how daily products pour, spread, squeeze, or feel in your hand. They support quality control by tracking internal friction and resistance. That is why oils, syrups, creams, and spreads can stay more consistent from one purchase to the next.
What’s the difference between a viscosity test and a rheology test?
A viscosity test usually gives a single value for flow resistance under set conditions. A rheology test goes further by showing how a material changes under different shear stress levels. In many labs, a rheometer is used when dynamic viscosity alone does not explain the full behavior.
Can results from rheometers and texture analyzers predict consumer satisfaction?
Yes, they can help. A rheometer shows how a product flows, while a texture analyzer shows how it feels under force. Together with viscosity measurements, they reveal material property details linked to pouring, spreading, and handling, which can support better predictions of consumer satisfaction.
Recent Posts
How Viscosity, Rheometer & Texture Analyzer Shape Product Quality in R&D Laboratories?

How Laboratory Heating & Cooling Equipment Improves Accuracy and Efficiency in Testing?

The Role of Laboratory Safety & Environmental Monitoring in Risk Prevention

Health and Hygiene Ware Material Testing: Ensuring Quality, Safety, and Compliance

Advancements in Sample Preparation Equipment for R&D and Quality Control

Essential Biotechnology Lab Items and Their Applications in Modern Research



Understanding ETP – Effluent Treatment Plant and Its Importance in Industry
Optimum Solution– Laboratory & Analytical Instruments Supplier in Bangladesh
Optimum Solution is a leading supplier of laboratory equipment, analytical instruments, and process control solutions in Bangladesh. Since our inception, we have built a strong presence in the industry, serving research labs, universities, pharmaceutical companies, and quality control laboratories nationwide. Through continuous dedication to improving our products and services, Optimum Solution has earned the trust and loyalty of our valued clients.


